 .
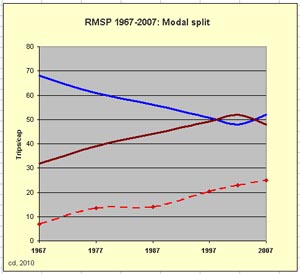
.4.1 Mobility and modal split
Saturation of surface
transport: modal
split reversed 2002 (with small increase of Metrô lines)
Buses:
8mn
daily since 1987; increase by Metrô. Avg travel time 59' 61' 69'.
|
|
 |
||||||||||||||||||
Propension to travel:
increase of demand through growth and redistribution of income
RMSP, 1997: Mobility by income. Public (blue) and individual (red) transport
|
|
|
|
T
e n
d e
n c
y |
M a
x c a p a c i t y |
P o l i
c y |
|
|||
|
|
Pop |
Mobil |
Vind |
Vcol |
Vind |
Bus |
Metrô(trip) |
Metrô(km) |
New(km) |
|
2007 |
|
1.2 |
10.5 |
12.2 |
10.5 |
9.1 |
2.3 |
65 |
|
|
2030 |
24.521 |
1.8 |
21.2 |
23.0 |
15.0 |
11.2 |
18.0 |
509 |
444 |
|
2050 |
29.538 |
2.1 |
29.8 |
32.3 |
20.0 |
12.1 |
30.0 |
848 |
339 |

