Previous
3 Facts and figures: a data summary
The São Paulo Metropolitan Area groups 39 municipalities where 18 million people live and work, produces about US$ 210 bn or 23% of Brazilian national product and 25% of its manufactures. The city of São Paulo (which is also capital city of the homonymous state), is by far the biggest among them in about every respect.
Population
| Population (1999, est.)
Urbanized area: Residential density |
18 000 000 inh
200 000 ha ( or 2 000 km2)
87 hab/ha
|
Regional product, budget and household income
| Regional product (1998)
Annual budget RMSP Of which City of São Paulo Average household income (1997):
Household occupation |
US$ 210 bn
US$9,0 bn
US$ 1 200 monthly
US$ 12 000 yearly 3,9 persons
|
Airports
| passengers
flights freight |
16,7 mn yearly
426 500 " 427 000 t " |
Public transport 1997
| Modality | Track length | Daily trips (mn) |
| Metrô
suburban rail bus lines |
49
30 180 000 |
1,7
0,7 7,8 |
| Total | . |
10,2
|
| Private: |
Number of cars (mn)
|
Daily trips (mn)
|
| Car, taxi |
3,44
|
9,6
|
Car ownership and daily trips 1967-97
| Year |
Cars
(000) |
Cars/cap
|
Car trips
(000) |
| 1967
1977 1987 1997 |
493
1384 2014 3426 |
0.069
0.135 0.141 0.204 |
2.284
6.146 8.250 10.150 |
Public transport and modal split 1967-97
| Year | Daily trips
Cars |
(per capita)
Public |
Daily trips
Cars |
(total, 000)
Public |
Modal split
Cars/total (%) |
Daily trips
(per capita) |
| 1967
1977 1987 1997 |
0.322
0.598 0.579 0.604 |
0.687
0.936 0.737 0.624 |
2.284
6.146 8.250 10.150 |
4.876
9.614 10.500 10.470 |
31.9
39.0 44.0 49.2 |
1.01
1.53 1.32 1.23 |
Average travel times
On
public transport
59 min
By
car
27 min
Schools
Total
number of students 5,12
million
Of
which
Primary shcools
76,7 %
Secondary
14,0 %
University
9,3 %
University of São Paulo
São Paulo campus
Area
580 ha
Students
60.000
Teachers
4.800
Clerks
17.000
Age structure
 |
Figure 4 São Paulo Metropolitan Region 1998: Age structure
Under 14 yrs: 28
%
|
Home telephone terminals (1998)
2.143.075
Shopping centres (1998)
26
Garbage (1993):
21 200 t daily
Number of hospital beds (1992): 32 675
Parks and green area:
(City of São Paulo only)
2.930 ha
Built floorspace, total (1996)
São Paulo Metropolitan
(est.)
500.000.000 sqm
São Paulo City
329.000.000 sqm
Built floorspace
by type
City of São Paulo, 1991
| Bldg type |
.........Floorspace
(million sqm) |
Floorspace
(%) |
Growth rate
1986-91 (% p.a) |
| Houses
Flats Shops Office &services Manufactures |
129.891.222
67.266.081 31.930.284 36.589.003 26.872.874 |
44.4
23.0 10.9 12.5 9.2 |
1,5
5,4 4,6 4,2 2,3 |
| Total |
292.549.464
|
100,0
|
2,8
|
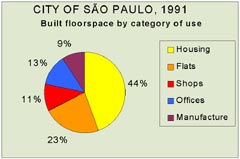
| Figure 5 City of São Paulo, 1991- Built floorpace according to building type. |
Previous